We just released Perfetto v57 and I wanted to share the new things I’m most excited about. This is something I wanted to do for past releases but I just never quite got round to it. It’s also something I plan on doing more of going forward: there might even be dedicated pieces if I think the feature deserves it!
PyTorch traces reliably work!
What I’m most excited about in this release isn’t a feature but a bugfix. If you used the PyTorch profiler and opened the resulting trace in Perfetto, there was a decent chance some of your events would just not show up; specifically this would happen when these events overlapped each other on a single track.
Technically, PyTorch is in the wrong here. The Chrome Trace Event (JSON) format
says duration events on a track have to nest and can’t overlap; if you need
overlap, you’re supposed to use async events. chrome://tracing appears to
handle them, but its rendering is actually buggy as soon as a trace has real
overlaps; people just learned to live with it. So when a
bug came in January about
overlapping events being broken, I closed it as working-as-intended because I
couldn’t see any easy fix from our end.
Then over time, I realized it wasn’t just one person with a weird trace. The bug had affected many different PyTorch traces, and even JAX traces. I even discovered that people were maintaining forks and hosting old versions of Perfetto just to deal with this issue. This is basically Hyrum’s Law: it doesn’t much matter what the spec says, once enough people rely on some behaviour, that behaviour is your contract.
This is also a very similar situation to what I discussed in Perfetto and open source: it was genuinely hard for me to tell just how many people it was affecting at the beginning: if I had understood, I would have dealt with this very differently.
In any case, in v57, Perfetto now imports the overlapping events instead of dropping them, overflowing the extras onto a different line in the same UI track. I do have to credit @i_komarov who helped me understand how big this issue was and to converge on the fix.
Recording systemd journald logs
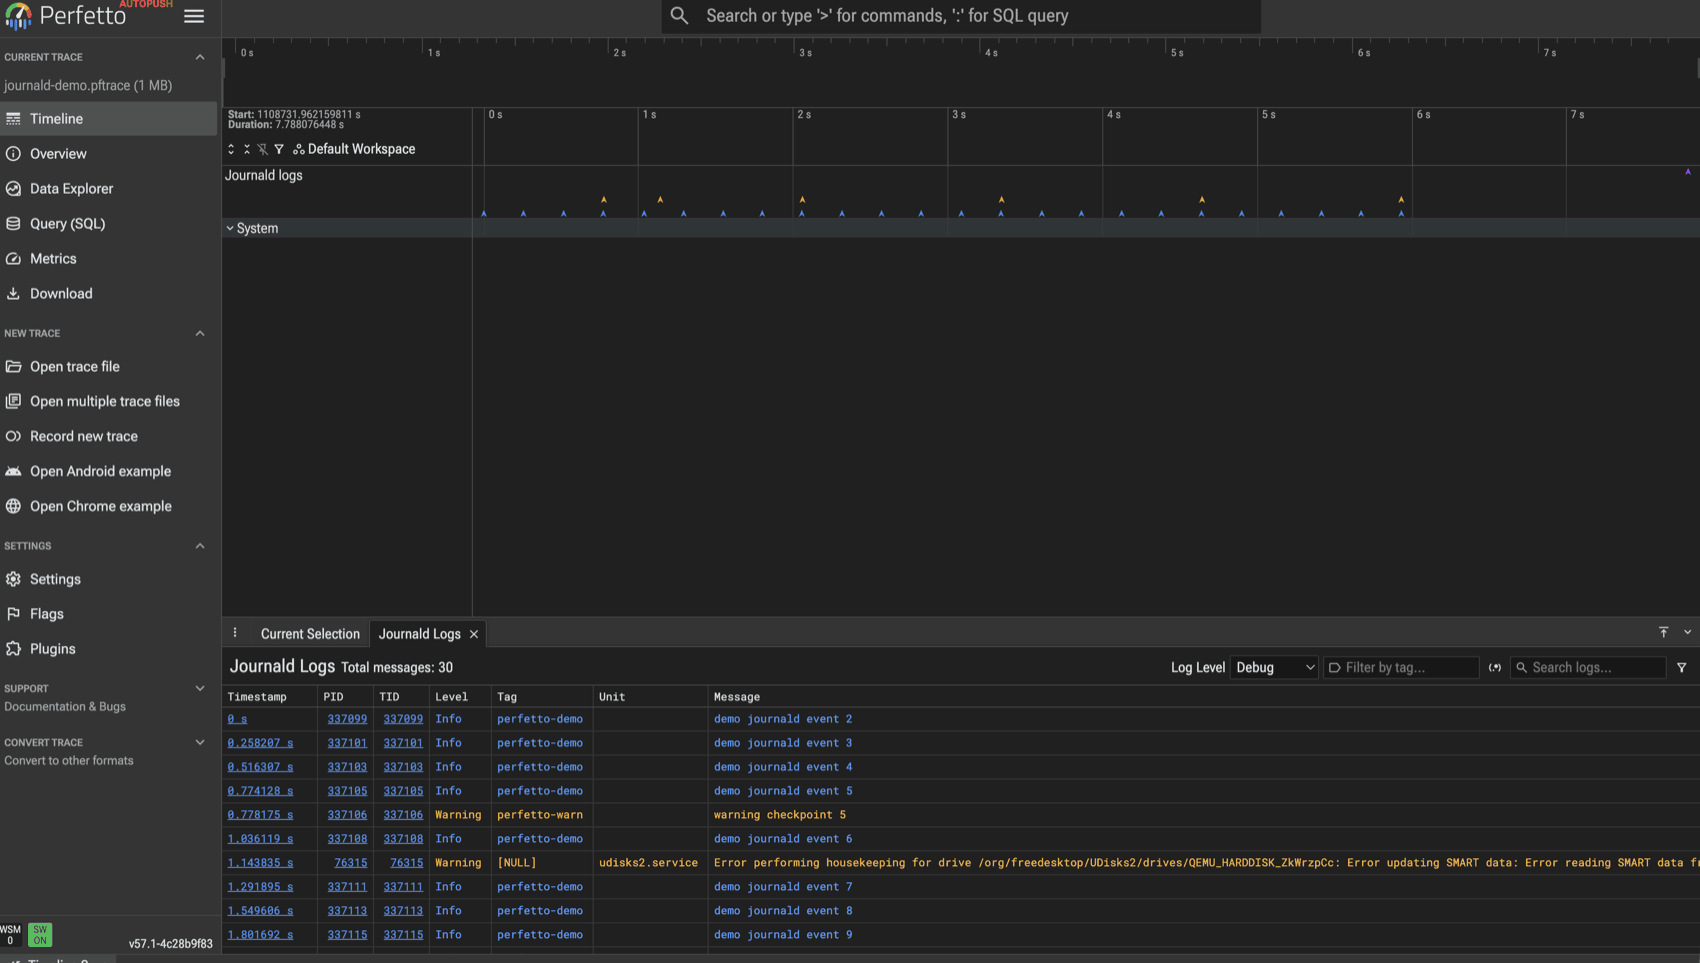
Perfetto has always tried to give you as much context as possible about what the system is doing and put it all on a single timeline. One missing piece of that on Linux has been in logs from journald; there’s a ton of useful information there but until now it was hard to correlate that with e.g. scheduling or other app level information.
With v57, there’s now a linux.systemd_journald data source that records
journald entries straight into the trace, on the same timeline as everything
else. You can filter by minimum syslog priority, by SYSLOG_IDENTIFIER, or by
systemd unit, so you are not pulling in the entire journal when you only care
about one service.
To show it in action, here’s a trace I recorded on my own machine. Alongside a few log lines I generated myself, it happened to capture a real udisks SMART error that fired while I was recording; exactly the kind of thing you’d otherwise miss.
I have to shout out @staticfloat who contributed this feature; thanks a lot for doing this!
An AI skill for recording and analysis
For a while now, people have been building their own AI tooling around Perfetto. SmartPerfetto and perfetto-mcp are two public examples I’ve come across but many teams inside Google have built their versions of these which each handle a subset of Perfetto’s functionality. To us, this is a sign that there’s demand out there to build something upstream so that everyone can benefit.
v57 includes an installable AI skill that works with Claude Code, Codex, Pi, Opencode, Antigravity, and anything else that speaks the Agent Skills format. It explains to the agent how to record traces (Android only for now!) and then query them. It also includes dedicated workflows for debugging Android memory, a specific area of focus for us; we plan on expanding these workflows over time including to Linux.
The skill is just one piece of a much larger AI plan, which I wrote up as an RFC. We will be doing much more in this space in the coming months.
State tracks
State tracks are a new kind of primitive in Perfetto, sitting alongside slices and counters. They represent something that is always in exactly one state: a connection that is open or closed, a device that is on or off, a worker that is idle or busy. You could already model this with slices, by emitting a slice that starts when a state begins and ends when it changes. This works but you have to be careful to emit events exactly at the same timestamps or you end up having gaps.
With a state track you don’t emit start and end events at all. At each point where the state changes, you emit one event that says what the state is now. The previous state ends automatically. Clearing the track marks it idle. This just makes it a lot simpler to manage.
While the simpler emission model is the obvious win, the reason we made it a first-class primitive goes further than that. Because a state track holds exactly one value at any moment, it can never overlap itself, and the trace processor can lean on that guarantee to treat it specially. You can attach arguments that change as the state does. And in ring-buffer traces, where old events get overwritten as the buffer wraps, you can periodically re-emit the current state, so a trace that starts mid-stream still knows what state everything is in.
State tracks are still quite new so there are likely to be some rough edges here, but we think they’ll become an important primitive: because they’re guaranteed never to overlap, you can do things with them you simply couldn’t before.
Querying traces over HTTPS
I recently discovered that quite a few folks have written scripts which download a trace and then run queries against it with the trace_processor CLI. Which made me think: why don’t we just support that natively inside the CLI itself?
So in v57, trace_processor takes an http(s) URL or a ui.perfetto.dev share
link directly. It streams the trace and runs your query with no local copy. Here
it is against the journald trace from the previous section:
$ trace_processor query \
    "https://lalitm.com/traces/journald-demo.pftrace" \
    "select log_source, count(*) as n from logs where msg is not null group by log_source"

"log_source","n"
"systemd_journald",30
It’s one of those small polish features which you wouldn’t necessarily think of immediately but when you have it, you’d never want to go back.
Lightning round
A few smaller things also landed:
- Shift + mouse wheel scrolls the timeline horizontally. A tiny change that removes a daily papercut when you are panning around a wide trace.
- The query results grid got a real overhaul. You can sort, reorder, and hide columns, the sidebar collapses, and SQL errors now show up in the grid instead of disappearing.
- Adjacent slices that share a boundary render with a 1px gap, so a run of back-to-back slices reads as separate slices rather than one solid block.
- Saved textproto record configs are editable, saving the trouble of downloading the config, deleting it, editing it locally, and then reuploading.
Wrap up
Overall this was a pretty solid release of Perfetto; it’s always satisfying to fix a bug blocking a lot of people. AI skills and state tracks are both first steps in a much longer journey, and journald logs are an important new capability that improves our Linux support. The rest are mostly a bunch of small quality of life improvements which are always nice to see!