PyTorch profiles are going to look much better in the next release of Perfetto.
Last time, I explained how PyTorch’s profiler emits events that overlap in ways that are technically forbidden by the Chrome JSON Trace Event spec. As a result, Perfetto used to drop these events on the floor. In the last release we stopped doing that, keeping all the events and merging the overlapping ones back together for display.
Unfortunately, this fix is more of a workaround: in practice, the trace simply does not record which events contain which, so we have to guess how they should be nested. So exactly as I had expected, we received a bug report complaining of poor rendering.
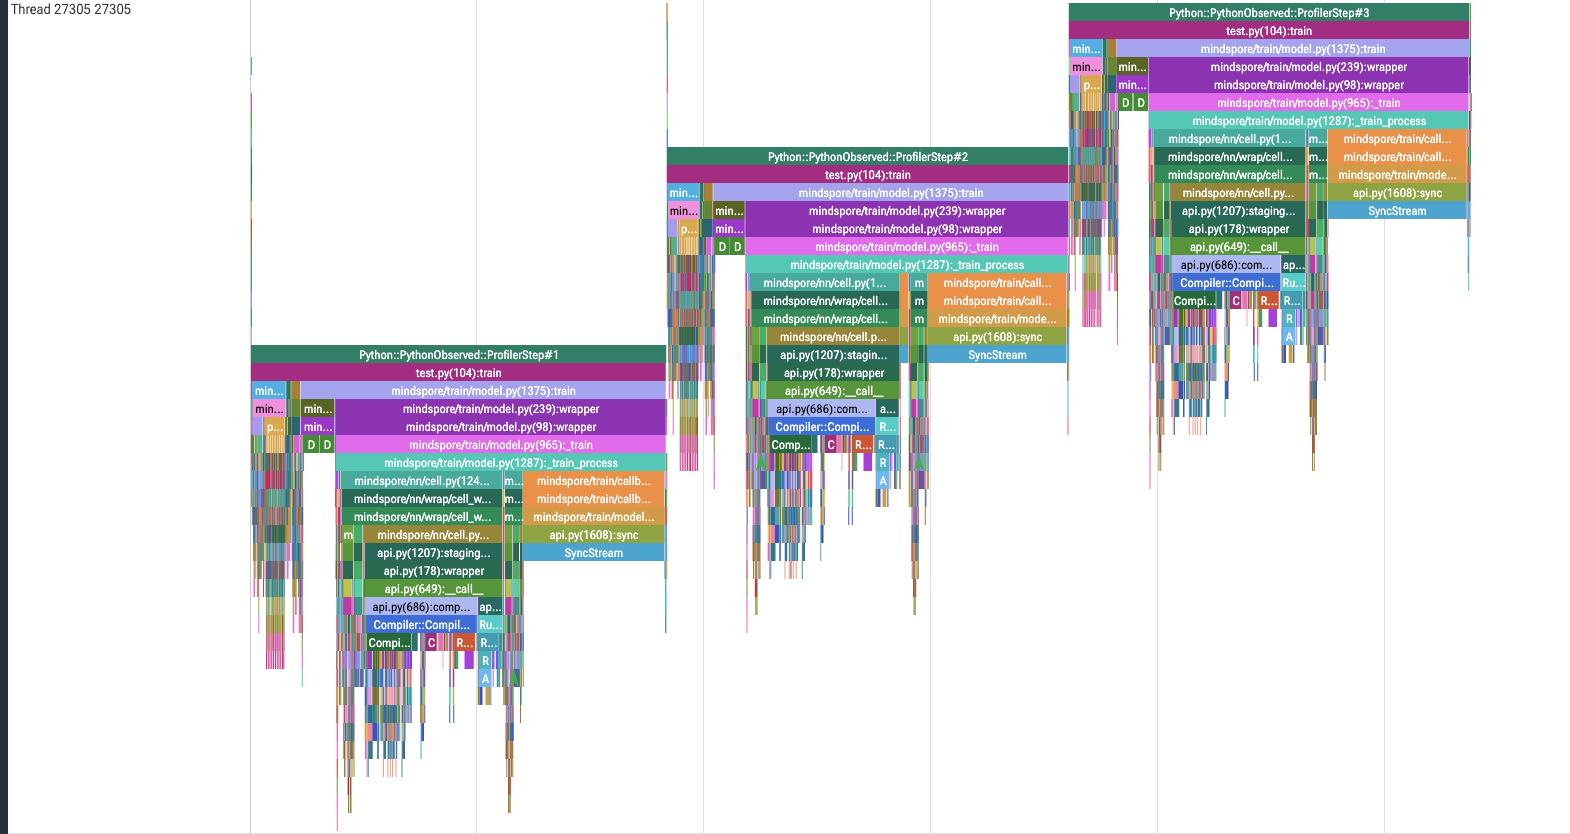
Our rendering algorithm for slices (the bars on the timeline), one we had used for years, computed a bounding box around every stack, processed those boxes in start-time order, and placed each into the lowest free rows. It works, but in the pathological case a wide, shallow event could start first, occupy the width of the track, and push a much taller stack down. That is exactly what happened in the reported trace.
I changed the algorithm to sort the boxes tallest-first, then place each into the lowest contiguous rows that remain free for its entire time interval. Deep call trees claim the low rows first; broad one-row markers settle outside them.
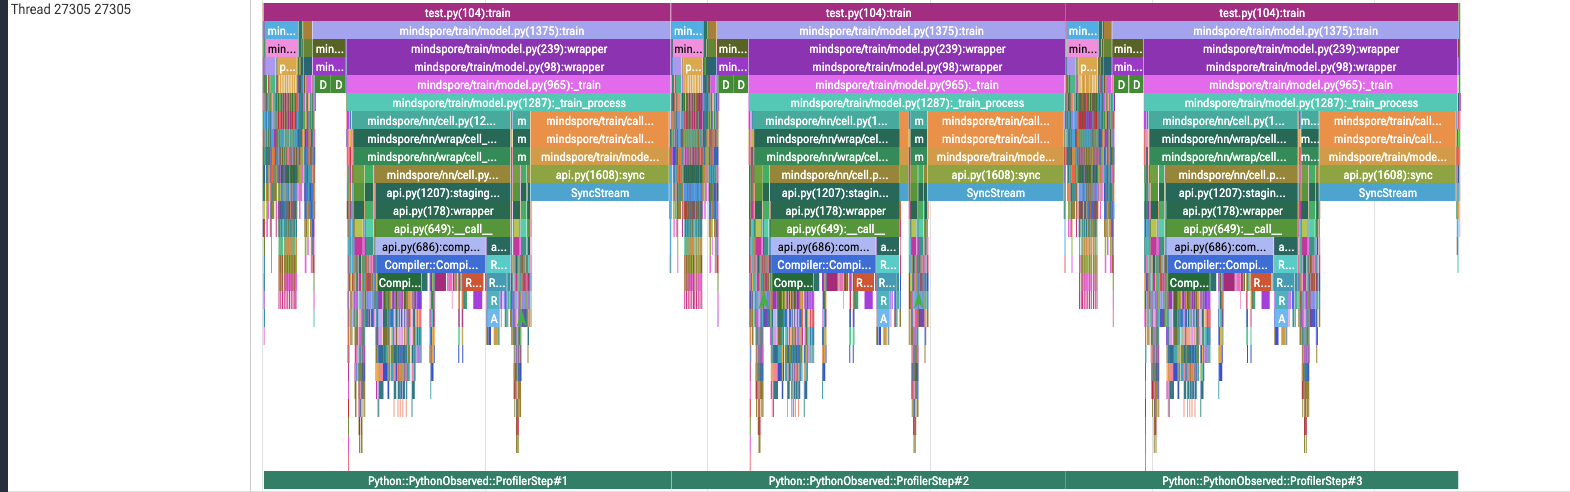
The same trace is now far more compact and readable. This still cannot reconstruct information missing from the trace, but it is at least a much better visual guess.